Canopy Growth and GW Pharma Both Broke Out From Their Inverse Head and Shoulders Chart Patterns Today
These Pot Stocks Surged 9% and 12.5% Today as Technical Traders Piled In, Let’s Calculate Their Price Targets
Two of the largest Cannabis Stocks in the industry added further confirmation that the sector has bottomed out. Canopy Growth (TSX: WEED) (NYSE: CGC) (FRA: 11L1) and GW Pharma (NASDAQ: GWPH) are sector bellwethers, meaning they are leading indicators and will usually move first before the rest of the group follows suit.
Over the past month, we mentioned that Canopy Growth and GW Pharma had very bullish chart patterns and would likely breakout in January. Both CGC and GWPH broke out today from their Inverse Head and Shoulders chart formations gaining 12.51% and 8.91%, respectively.
Canopy’s breakout is being fueled by strong technicals, news of the company’s new profit-driven CEO, the release of its new Cannabis 2.0 products and the planned opening of 10 additional Tokyo Smoke stores in the newly improved Ontario retail market. There is also a rumour circulating that Constellation Brands (NYSE: STZ) (FRA: CB1A) may buy out the rest of Canopy taking 100% control of the company. While that may seem like a realistic move by Constellation, Scott Willis of Grizzle lays out a compelling case on why a buyout of Canopy will never happen. You can read that article here.
GW Pharma’s rise is being driven by an excellent chart, stronger than expected sales of its CBD based Epilepsy drug Epidiolex, Jim Cramer of Mad Money calling it a long-term hold and yesterday evening’s pre-announced preliminary Q4 and FY 2019 sales figures. Based on GW Pharma’s preliminary unaudited financials, the company is anticipating Q4 and FY 2019 total net product sales to come in at roughly $108 million and $309 million, respectively. Epidiolex sales for the fourth quarter are projected to be $104 million and $296 million for the full year 2019. GW Pharma said its cash position as of December 31, 2019, was approximately $536 million. The company will report Q4 and FY 2019 earnings on February 25, 2020.
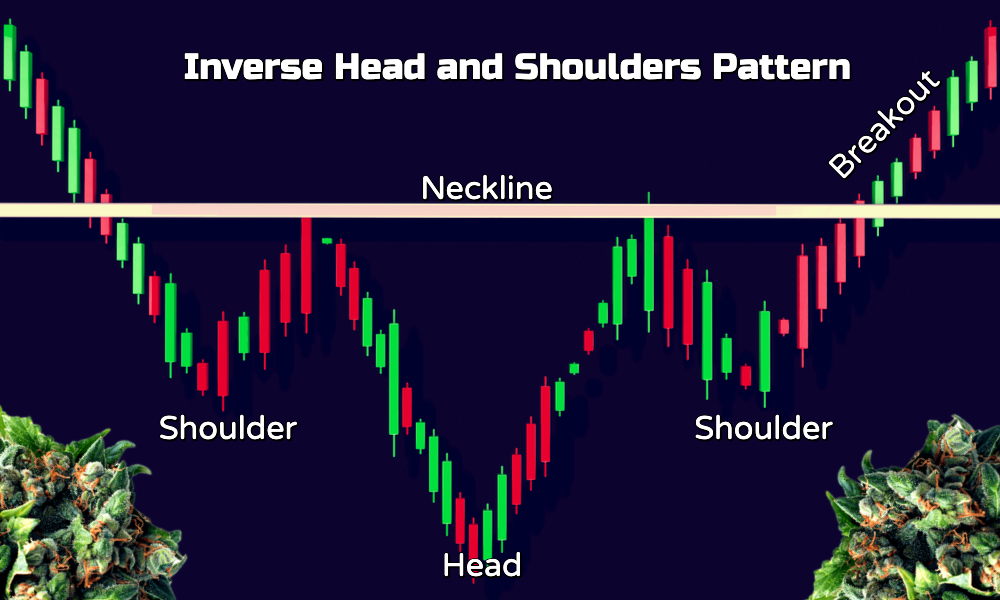
What is an Inverse Head and Shoulders Chart Pattern?
You may have heard of the standard Head and Shoulders pattern which is used to determine if a stock has topped out. The Inverse Head and Shoulders pattern is the inverted version of the standard H & S formation and is used for spotting stocks that are ready to reverse a downtrend and begin a new uptrend.
The Inverse H & S pattern is made up of the following components:
- Shoulder: Following a long downtrend, the price of a stock drops to a trough forming the first shoulder and afterwards rises to form a peak.
- Head: The stock’s price drops again to form a second trough which is considerably lower than the previous low forming the head of the pattern followed by the stock rising again.
- Shoulder: The price of the stock drops again for the third time to roughly the same level as the first trough forming the second shoulder followed by the stock rising one more time to break out above the resistance neckline of Inverse Head and Shoulders pattern.
- Volume: Look for a spike in volume as the stock breaks out above the neckline. Volume is more important with the Inverse Head and Shoulders pattern than it is with the standard version. Strong volume will confirm the breakout’s validity. The higher the volume spike the better.
Now that we have a better idea of what is driving these stocks higher and how an Inverse Head and Shoulders pattern looks and works, let’s take a closer look at both charts and calculate the price targets for each breakout.
Source: Shutterstock
Calculating Price Targets
To calculate the price target of an Inverse Head and Shoulders pattern we need to measure the distance from the bottom of the ‘Head’ to the ‘Neckline’. We then take that distance and add it to the breakout point on the neckline and it will give us our estimated price target.
- Price Target Formula: Neckline (N) – Head (H) + Neckline (N) = Price Target (PT)
Canopy Growth (NYSE: CGC) Price Action and Chart
Canopy Growth (CGC) formed ‘Shoulder #1’ of its Inverse Head and Shoulders pattern when CGC stock touched a low of $17.89 on October 14, 2019. CGC then rallied temporarily before declining again to an even lower point of $13.81 on November 19, 2019, forming the ‘Head‘ of the pattern. CGC rallied sharply from that low before consolidating sideways until the stock declined for a third time to a level equal to shoulder #1 thus creating ‘Shoulder #2’. Finally, CGC broke out above the ‘Neckline’ at $22.25 today on a solid increase in volume. Importantly, the stock closed well above the neckline and only $0.09 off the high of the day (HOD).
- Neckline = $22.25
- Head = $13.81
- $22.25 (N) – $13.81 (H) + $22.25 (N) = $30.69 (PT)
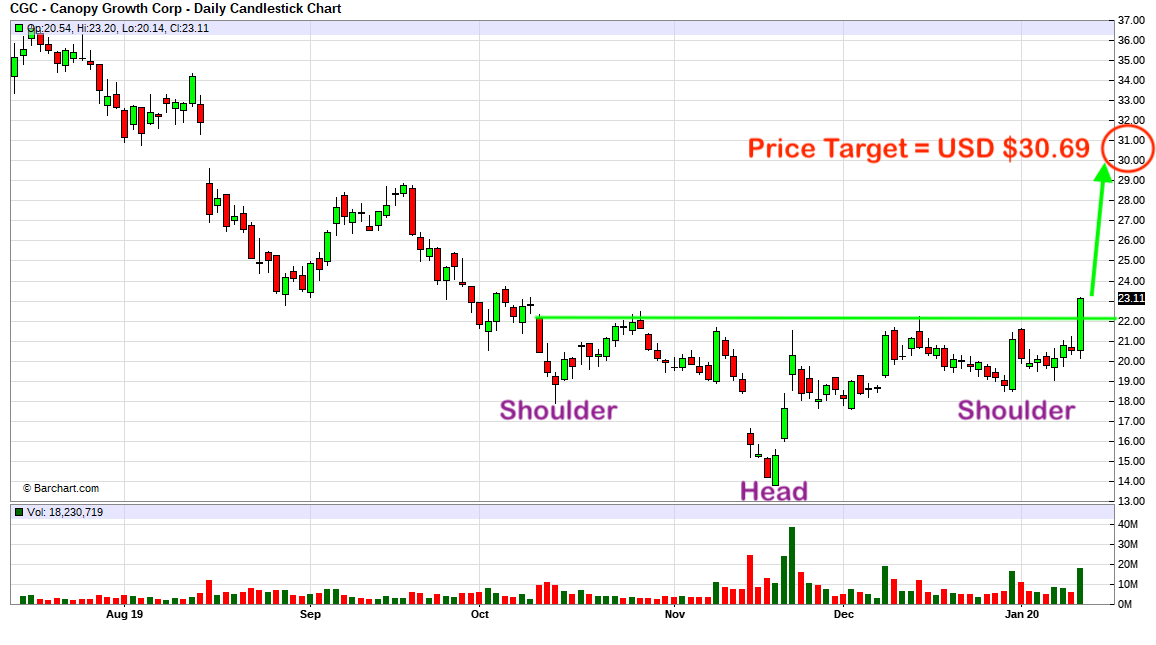
Source: Barchart.com
Learn more about Canopy Growth: Website | IR Website | Investor Deck | WEED Chart
GW Pharmaceuticals (NASDAQ: GWPH) Price Action and Chart
GW Pharma’s Inverse Head and Shoulders pattern isn’t as pronounced or perfect as Canopy’s but nevertheless, it’s still worth taking a look at. GWPH formed the ‘1st Shoulder’ of its chart formation when the stock touched a low of $98 on November 26, 2019. The stock formed the ‘Head’ of the pattern by hitting a new low of $95.90 on December 10, 2019. GWPH rallied from here before dropping again to $99 where it formed the ‘2nd Shoulder’. GWPH stock gapped open today blowing by the $111 ‘Neckline’ on a sizeable increase in volume to break out and complete the pattern.
- Neckline = $111
- Head = $95.90
- $111 (N) – $95.90 (H) + $111 (N) = $126.10 (PT)
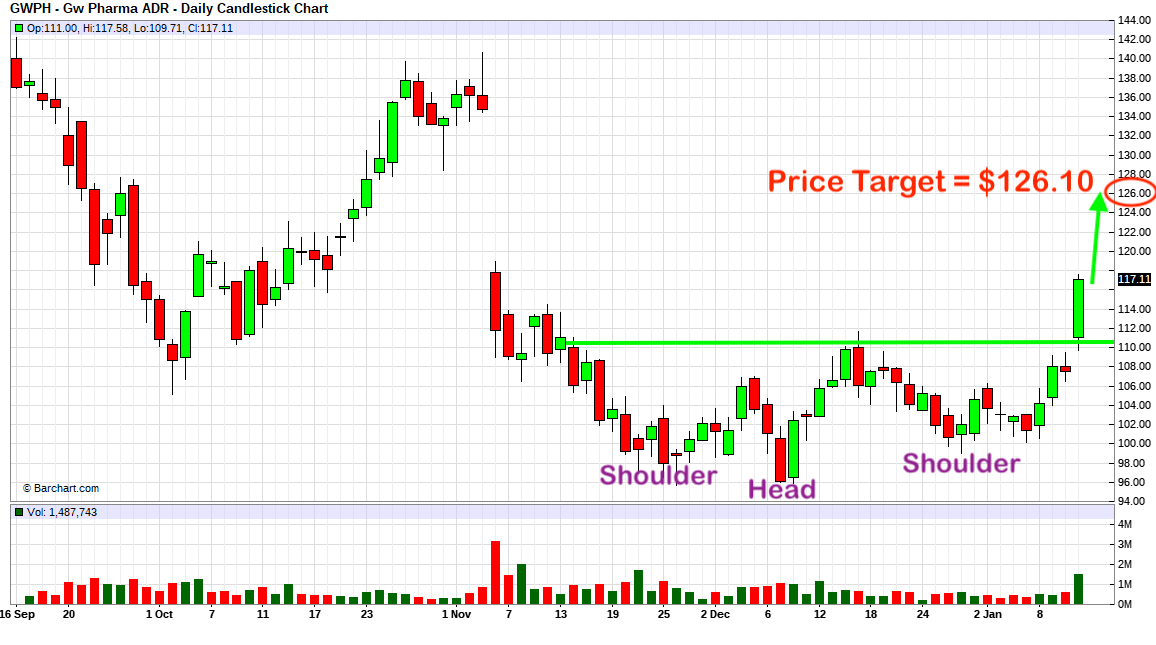
Source: Barchart.com
Learn more about GW Pharma: Website | IR Website | Investor Deck | GWPH Chart
Also Read: Have No Beer, Legal Weed is Here: Beer Sales Decline as Canadians Opt For Legal Cannabis
3 Alcohol-Cannabis Partnerships Poised to Generate Huge Sales in the New Cannabis 2.0 Market
*** Get Your Copy of The Ultimate Cannabis Investing Guide ***
Join the Discussion in the TCI Investor Group
Disclosure: The Cannabis Investor does not hold a position in any of the stocks mentioned in this article.
Read More:
Featured ArticlesCannabis Stock NewsCannabis Industry ArticlesTechnical Analysis ArticlesWatch Cannabis Stock Videos