Adding This Tool to Your Trading Arsenal Will Help You Bottom Pick Pot Stocks More Effectively
In one of our previous ‘how-to’ technical analysis (TA) articles we discussed in-depth how to use the Relative Strength Index (RSI) to determine whether a marijuana stock was oversold or overbought. We also looked at using the RSI to predict when a run was over so we could take profits accordingly before the stock rolled over.
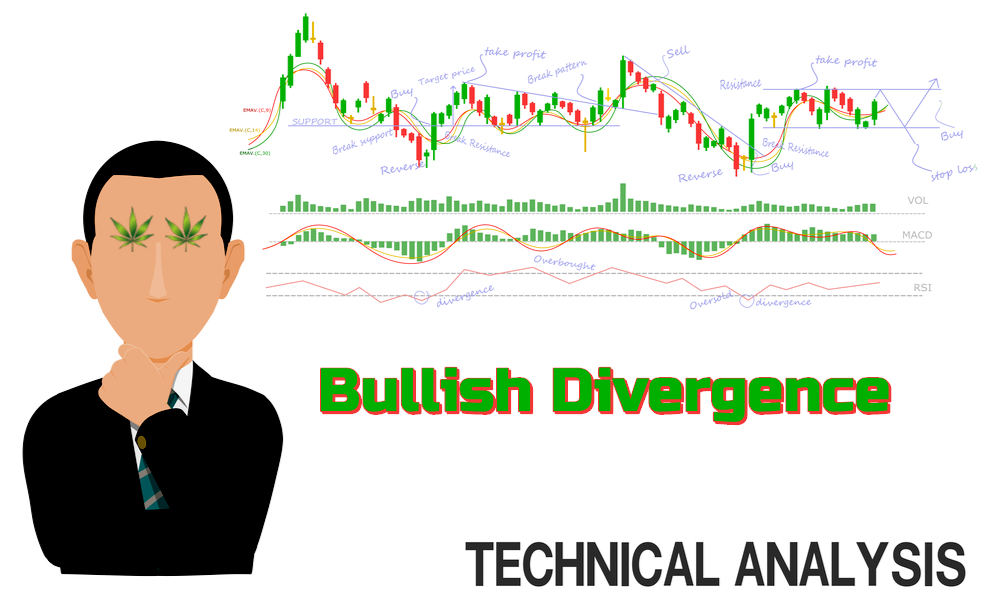
Today we will be using the RSI oscillator in a different way and applying it to a candlestick stock chart in order to look for bullish or bearish divergence. Since we are currently at the tail end of a cyclical down market in cannabis equities, we will mostly be focusing on bullish divergence in this article. You can use other oscillators to look for divergence, but for the sake of simplicity, today we’ll just be using the RSI.
What is Divergence?
As per Investopedia: “Divergence is when the price of an asset is moving in the opposite direction of a technical indicator, such as an oscillator, or is moving contrary to other data. Divergence warns that the current price trend may be weakening, and in some cases may lead to the price changing direction.”
Now that we have the definition of divergence established, let’s take a deeper look at the two different types, starting with bearish divergence and briefly going over it.
Bearish Divergence
“Bearish divergences signify potential downtrends when prices rally to a new high while the oscillator (RSI) refuses to reach a new peak. In this situation, bulls are losing their grip on the market, prices are rising only as a result of inertia, and the bears are ready to take control again.” – Investopedia
Very straight forward. Now, let’s move over to bullish divergence and take it a step further by applying it to certain cannabis stocks at today’s market prices. You can use the same information to look for bearish divergence at the end of the next market rally. Just flip flop the concept.
Bullish Divergence
“A bullish divergence occurs when prices fall to a new low while an oscillator fails to reach a new low. This situation demonstrates that bears are losing power, and that bulls are ready to control the market again—often a bullish divergence marks the end of a downtrend.” – Investopedia
Source: Shutterstock
How to Put Your Plan Into Action
Now that we’ve established the meaning of divergence and reviewed the difference between the bearish and bullish variations let’s get you ready to implement this new game plan in today’s market which is ripe for bottom picking. The steps below are used to look for bullish divergence. The same process can be used to seek out bearish divergence at the end of a bull market run.
Step 1: Make a watchlist of cannabis stocks that you’ve done your due diligence on and are considering making an investment in.
Step 2: Find a stock charting service that offers interactive technical charts with candlestick and technical indicator options. Personally, I use Barchart.com for all my charting needs. Barchart’s free charting service is more than enough to do the job here.
Step 3: Take your watchlist and pull up a candlestick chart of each stock and add the RSI indicator to the bottom of each chart.
Step 4: Look to see if the stock has recently made a new low on the current downtrend. Take the stocks with new lows and move them to the top of your list. Take the stocks with new lows and determine the RSI number the day the new low was reached and compare that number to the previous low’s RSI number.
If the stock made a new low price but the RSI didn’t make a new low as well, then we have a case of bullish divergence on our hands and that stock should be moved to the top of your watchlist and monitored closely.
To finish off this article, we’ll show you a couple of real-life examples of recent bullish divergence in action. Please remember, anything can happen in the financial markets and just because a stock makes a bullish divergence doesn’t mean it has 100% hit a bottom. It only means your odds greatly increase that it has bottomed. Investing in the stock market is a game of odds and probabilities. You want to stack the odds in your favour and using this tactic is one way to do that.
There are actually three classes of divergence which you can read more about here. In order to keep things simple, the examples in this article will only focus on the strongest ‘Class A Divergences’. We’ll get more into Class B and C in a future article. The examples below are of Class A Bullish Divergence.
Example #1
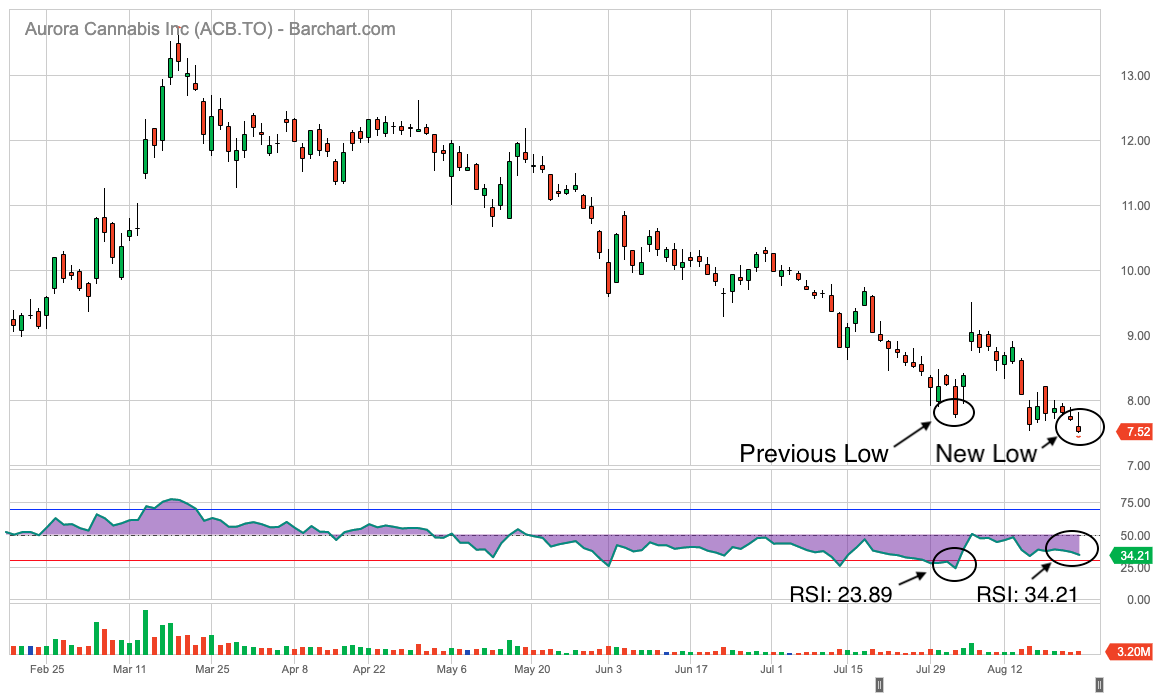
Aurora Cannabis (TSX: ACB) (NYSE: ACB)
- Previous Low: $7.73 | RSI = 23.89
- New Low: $7.50 | RSI = 34.21
Notes: In the case of ACB we have a clear as day bullish divergence that actually just took place on Friday. Since this one is very fresh, the opportunity to capitalize on it is the highest. Rather than jumping straight in on Monday, you could watch the stock for a couple of days in order to establish confirmation. Ether one is fine. I don’t think you can go wrong investing in Aurora at today’s levels.
Source: Barchart.com
Start Your Due Diligence on Aurora Cannabis: Chart | Website | IR Website | Investor Deck
Example #2
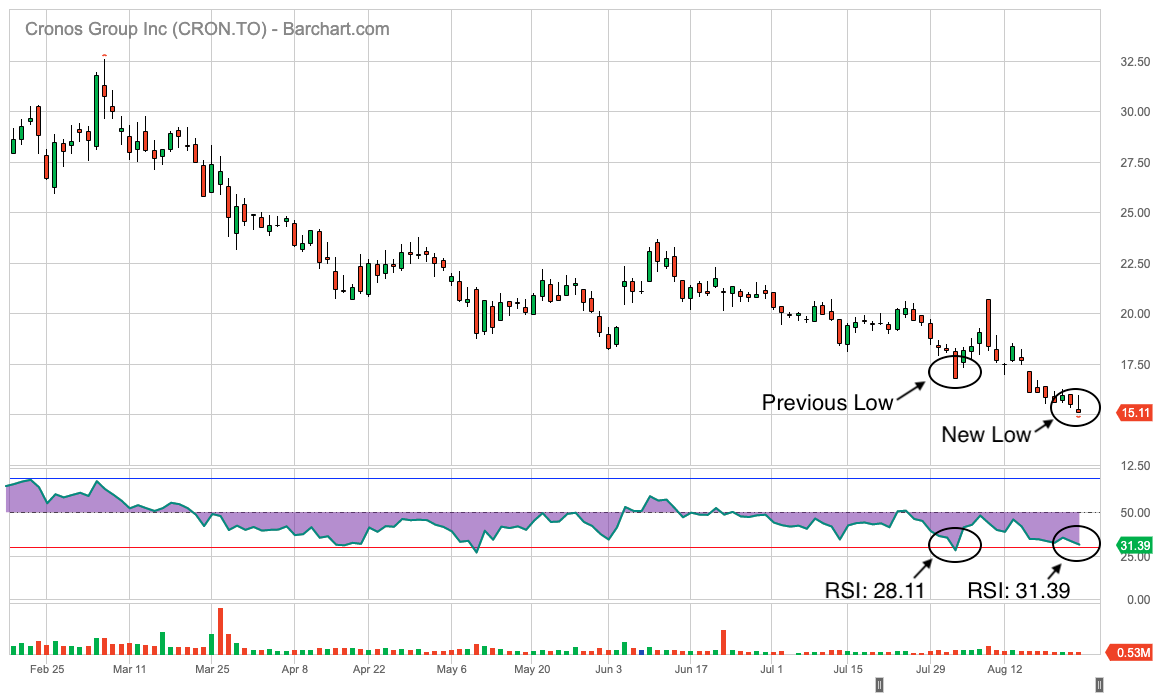
Cronos Group (TSX: CRON) (NASDAQ: CRON)
- Previous Low: $16.78 | RSI = 28.11
- New Low: $15.09 | RSI = 31.39
Notes: After reviewing Cronos Group’s chart we see nearly the identical situation as Aurora’s developing. Aurora’s divergence is slightly larger making it a little more attractive in my opinion. Cronos also made a new low on its current downswing this past Friday but its RSI did not. CRON’s RSI closed Friday’s trading session at 31.39 while the RSI on the stock’s previous low was 28.11. Clear cut case of bullish divergence.
Source: Barchart.com
Start Your Due Diligence on Cronos Group: Chart | Website | IR Website | Investor Deck
Honourable Mention
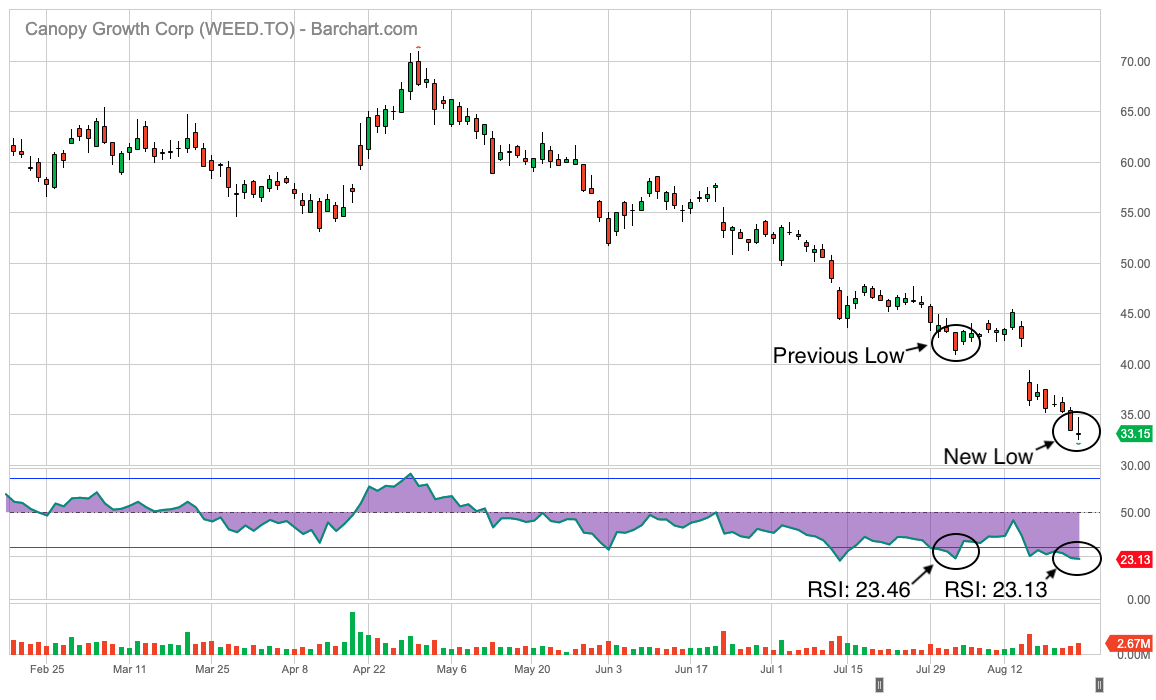
Canopy Growth (TSX: WEED) (NYSE: CGC)
- Previous Low: $40.89 | RSI = 23.46
- New Low: $32.47 | RSI = 23.13
Notes: If you look closely, Canopy’s stock fell just shy of making an official bullish divergence but I thought it was close enough to mention. It is likely that Friday’s close could end up being the bottom for Canopy. If that doesn’t end up being the case then it’s almost certain that Canopy will make a divergence on its next low and in the process form its bottom. Something happened recently with Canopy that caught my eye and in my opinion, indicates we are at the bottom of this latest market downswing.
Canopy’s former CEO Bruce Linton recently announced he purchased additional WEED shares in the market. Linton stated, “When it’s cheap you buy more”. He likely waited until after Canopy reported its dismal earnings in which it lost roughly $1.3 billion in Q1 knowing the worst was over for the company and that the stock and the market was bottomed out. It’s very common for industry insiders like Linton to help set a bottom when they buy in the market like this. Something to think about for sure.
Source: Barchart.com
Start Your Due Diligence on Canopy Growth: Chart | Website | IR Website | Investor Deck
There you have it, you are now ready to take your new-found knowledge and apply it in the markets. The timing of this article could not be better as many believe we are nearing a major reversal in the cannabis market. Since most cannabis stocks have taken a beating this summer, there should be no shortage of stocks for you to test out your bullish divergence plan on.
As always, don’t invest blindly into any stock, do your homework first and only use this information as part of your overall strategy. Technical analysis is great for making short term trades or spotting reversals but it is ultimately a company’s fundamentals that will drive share price growth over the long-term. It’s best to use a combination of technical and fundamental analysis when making your investment decisions.
Best of luck to you all and happy investing.
Ryan Troup
Editor in Chief | The Cannabis Investor
Email: Ryan@Circadian-Group.com
2019’s #1 Stock Pick | New Cannabis IPO Coming Soon
Move over Canopy. The world’s largest cannabis company is set to IPO in less than 30 days.
Get the full details here so you don’t miss out on the next potential 10 bagger.
*Get Your Copy of The Ultimate Cannabis Investing Guide*
Read More:
Featured ArticlesCannabis Stock NewsCannabis Industry ArticlesTechnical Analysis ArticlesWatch Cannabis Stock Videos